Visualize RDS DB Performance with Performance Insights
One of the main advantages of using resources on the cloud is the advanced monitoring capabilities that the main Cloud providers offer by default as part of the resource you are using.
This has the advantage of letting you instantly know how your cloud resource is performing and makes it easy to troubleshoot the minute(or even the second) it's up and running. There is no need to integrate with third-party monitoring and logging providers.
If you are currently using an on-prem relational database and are thinking of moving your DB to the cloud, you will no doubt consider Amazon Web Services offering, AWS RDS. RDS Stands for Relational Database Service and it's a managed DB service for relational databases.
It offers several engines namely Postgres, MySQL, MariaDB, Oracle, Microsoft SQL Server and a proprietary offering from Amazon, Aurora(the capabilities and benefits of which deserve its own topic).
RDS offers many advantages such as Continous backups, Automatic OS patching by AWS, Multi AZ setup for disaster Recovery and makes it possible to instantly scale up both vertically and horizontally.
It also offers superb monitoring capabilities with both standard cloudwatch dashboards and enhanced monitoring capabilities
A cool functionality of AWS is Performance insights, a useful feature that helps you visualize your database’s performance and helps your team to analyze any issues that affect it.
The feature is enabled on the AWS Console under the RDS menu. Its is currently limited to certain regions and instances but this changes often so it is always important to consult the official AWS page for the latest updates.
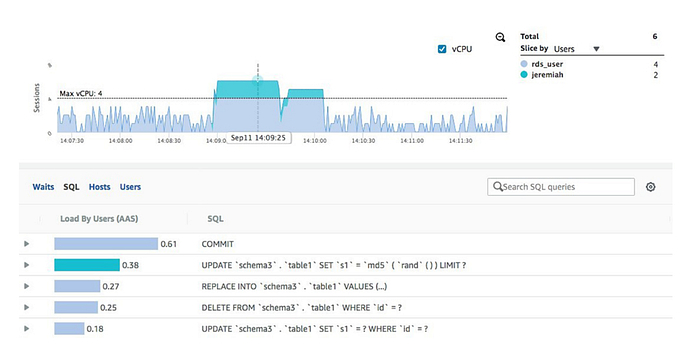
The central metric is the DB Load collected every second. The DB Load graph shows four dimensions; waits,SQL, hosts and users.

You can filter the graph by any of the 4 dimensions. Below is what each does;
- Waits: A wait event is one which causes an SQL statement to wait for a specific event to happen before it can continue running. This filter helps show which resource is causing the most bottleneck in your DB(CPU, IO etc) The screenshot above is an example
- By SQL Statements: This dimension filters shows which queries are contributing the most to the DB Load, slowing down your performance. This is very useful to developers and DBAs as it could help in optimizing queries on the db

3. By Hosts: This dimension filter helps identify the application server that is using the most resources on your DB. An example could be an analytics server that queries analytics on your main instance thus affecting your performance. Such a case could necessiate spinning up a separate read replica for the app server taking using the most
4. By Users: This dimension filter simply helps show the user using the most resources on your db as well as the queries they made. This can be useful in pinpointing which user could be making queries that impact and stretch the available capacity of your RDS DB

As seen from the above sample screenshots, performance insights provides a nice and effective way for teams on the cloud to visualize, monitor, troubleshoot and optimize their cloud relational databases, its a useful tool that every cloud developer and DBA should get acquainted in. For more on it, check out AWS’s official documentation here.
More content at plainenglish.io

